In short
The right split depends on who gets the garments, the garment type and the style you pick. There's no universal formula. The starting point is an estimate: for a mixed group of adults the most requested size is L, followed by M and XL. Among mixed students and in women-only groups, M comes first.
In this article you'll find starting percentages for 12 types of group, stated as estimates, a selector by group and garment, ways to collect real sizes and the mistakes to avoid.
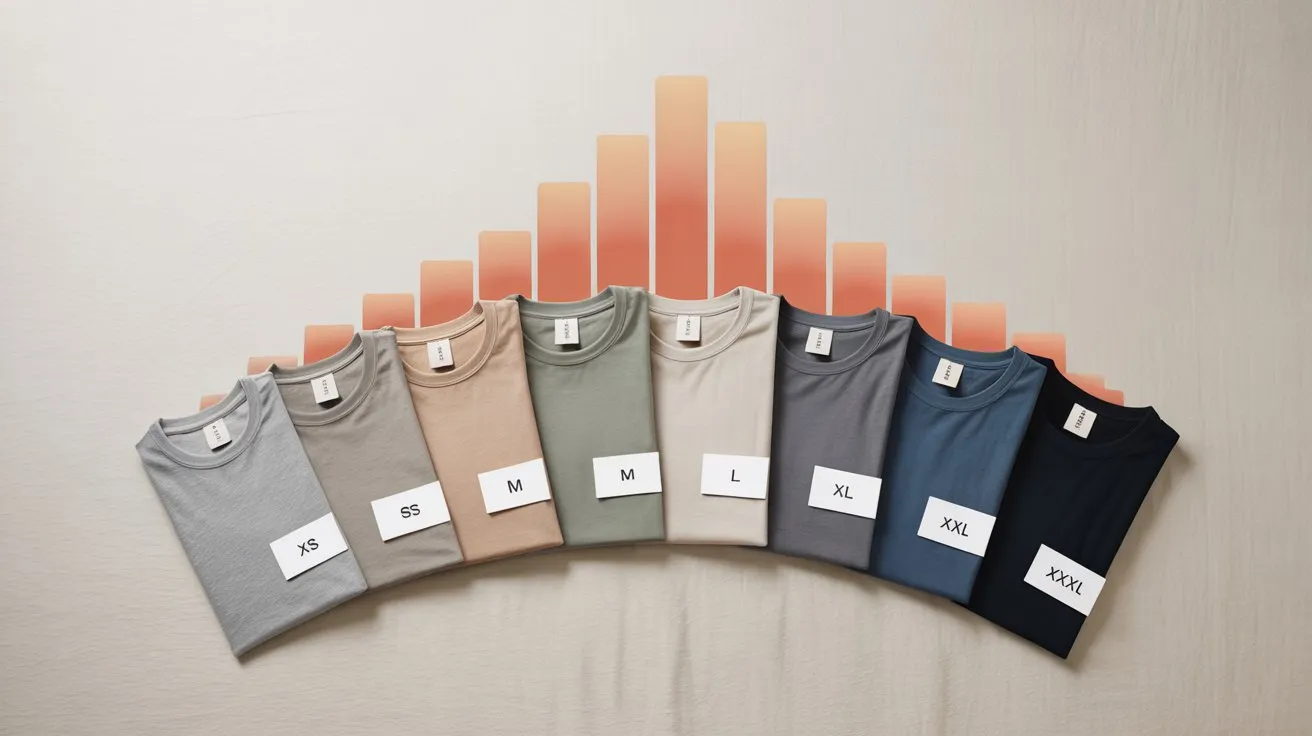
The curve
Why not to split sizes equally
Middle sizes run out, extreme sizes are left over.
A starting curve lowers the risk.
You need to order 100 t-shirts and the printer asks how many of each size. Instinct says the same quantity for all: 14 pieces each.
But the sizes in a group aren't evenly distributed. They cluster in the middle and change with age, gender and type of activity.
Mistakes cost money. Custom garments generally can't be returned. And a small reorder costs more per piece, because the setup work is spread over fewer garments.
| Equal split | A starting curve |
|---|---|
| Same quantity for every size | Different quantities by group, garment and style |
| Extreme sizes are left over | Few pieces go to the extremes |
| Middle sizes run out fast | More pieces go to the middle |
What a size curve is
The trade calls it a size curve: the percentage of pieces assigned to each size in an order.
We found no public Italian data on quantities ordered by size. SizeITALY, the large national measuring survey, covered over 6,000 people aged 6 to 75 in 18 centres between 2012 and 2013. It tells you about body shapes, not how many L to order.
A comparison comes from Clothes2order, a British supplier that has published the averages of its own orders. It's a single supplier, and it doesn't say how many orders the figures are based on.
Average percentages in adult t-shirt orders
- 32%size LClothes2order, order history
- 28%size MClothes2order, order history
- 19%size XLClothes2order, order history
- 10%size SClothes2order, order history
The estimates
Starting distributions
Every group has a different curve.
These are estimates: adjust them with your group's data.
They apply to unisex regular fit t-shirts. For other garments, see the next chapter.
Sports groups
| Segment (estimate) | XS | S | M | L | XL | XXL | XXXL | Peak |
|---|---|---|---|---|---|---|---|---|
| Mixed adult team (18–45) | 5% | 18% | 32% | 28% | 12% | 4% | 1% | M |
| Men only (18–45) | 1% | 5% | 18% | 36% | 28% | 9% | 3% | L |
| Women only (18–45) | 8% | 28% | 39% | 18% | 6% | 1% | 0% | M |
Example: for a mixed team of 50 people, the estimate gives about 16 M, 14 L, 9 S and 6 XL. Add a few extra pieces in L and XL for latecomers.
Corporate settings
| Segment (estimate) | XS | S | M | L | XL | XXL | XXXL | Peak |
|---|---|---|---|---|---|---|---|---|
| Mixed office staff (25–55) | 2% | 10% | 24% | 30% | 22% | 9% | 3% | L |
| Industry / logistics (mostly men) | 1% | 6% | 18% | 32% | 26% | 12% | 5% | L |
University students
| Segment (estimate) | XS | S | M | L | XL | XXL | XXXL | Peak |
|---|---|---|---|---|---|---|---|---|
| Mixed students (18–26) | 5% | 18% | 32% | 24% | 14% | 5% | 2% | M |
| Men only (18–26) | 2% | 10% | 28% | 30% | 18% | 8% | 4% | L |
| Women only (18–26) | 10% | 30% | 35% | 17% | 6% | 2% | 0% | M |
Other groups
| Segment (estimate) | XS | S | M | L | XL | XXL | XXXL | Peak |
|---|---|---|---|---|---|---|---|---|
| Mixed, no clear profile | 3% | 11% | 26% | 30% | 20% | 7% | 3% | L |
| Over 50 | 1% | 6% | 18% | 28% | 25% | 15% | 7% | L |
| Middle school, adult sizes | 25% | 40% | 25% | 10% | – | – | – | S |
For over 50s, only order XS if you know someone wants it.
Primary school: 20% size 6A, 28% 8A, 30% 10A, 17% 12A, 5% 14A.
The factors
What shifts the split
Garment, fit and gender change the curve.
Slim fit pushes towards larger sizes, oversized towards smaller ones.
The estimates apply to a regular t-shirt. Four things change them: the garment, the fit, the gender mix and the style. The style gets its own chapter next.
Towards larger sizes
Many people go one size up for comfort. The split moves up compared with a t-shirt.
Towards larger sizes, with more XXL
They're worn over other clothes. The same logic as hoodies applies, with a few extra pieces in XXL and XXXL.
Base split
People tend to take their usual size, so the base distribution works.
Towards larger sizes
At the same size, the garment is narrower. Anyone who doesn't want it tight goes one size up.
Towards smaller sizes
At the same size, the garment is wider. Anyone who wants a less baggy look goes one size down.
A proportional middle ground
A group that's 70% women has a very different curve from one that's 70% men. If you know the mix, pick a value between the “men only” and “women only” rows.
Find your starting point
Choose a group and a garment. The answer ranks the sizes where you should put most pieces. It's derived from the estimates above using SizePlan's logic. For over 50s, industry and schools, start from their own row.
Estimate: where to put the most pieces
L, then M and XL
This is the base distribution. The peak is L.
See all combinations
| Which garment are you ordering? | Team, students | Office | Men | Women |
|---|---|---|---|---|
| Regular t-shirt or polo | M and L, then S | L, then M and XL | L, then XL and M | M, then S |
| Slim t-shirt | M and L, then XL | L and XL, then M | L, then XL and M | M, then L and S |
| Hoodie | M and L, then XL | L and XL, then M | L and XL | M, then L and S |
| Jacket or gilet | M and L, then XL | L and XL, then M | L and XL | M, then L and S |
| Oversized t-shirt | M, then L and S | L and M, then XL | L and M | M and S, then XS |
The measurements
The style and the centimetres
The same letter doesn't mean the same t-shirt.
Measurements in centimetres matter more than the size letter.
Sizes aren't standardised, and the cut depends on the individual garment, not the brand. The same brand can have a regular style and a slim one, as SOL'S shows.
| Style | Stated fit | What to do |
|---|---|---|
| Gildan 5000 | Classic fit, tubular body | Compare the measurements with a t-shirt you already own |
| Stanley/Stella Creator 2.0 | Medium fit | Send the size chart to the group |
| SOL'S Regent | Regular fit | Start from the base distribution |
| SOL'S Regent Fit | Slim fit | Warn the group: if in doubt, go one size up |
| B&C #E190 | Regular fit | Start from the base distribution |
Converting between sizing systems
An M isn't the same everywhere, and generic conversion charts vary from source to source. That's why we don't publish one.
Look at the garment's measurements. A Gildan 5000 in size M is listed as about 51 cm wide and about 74 cm long. Compare those with a t-shirt you already own.
Children's sizes: age and height
Example from the SOL'S Regent Fit Kids. Other styles may differ.
| IT size | Approximate age | Height (cm) |
|---|---|---|
| 6A | 6 years | 106–116 |
| 8A | 8 years | 118–128 |
| 10A | 10 years | 130–140 |
| 12A | 12 years | 142–152 |
Collecting
How to collect sizes
Asking beats estimating, if you can do it.
Under 15 pieces, ask everyone.
If you can, ask everyone for their size. SizePlan itself warns that under 15 pieces the estimate isn't very reliable, and it works best from 50 pieces up.
Free Custoomy tool
You create the collection and send a link. Nobody has to sign up. Everyone chooses from the garment's real measurements, using MyFit or by measuring a t-shirt they own. You see who's missing, send a reminder and download the list as CSV or PDF. If needed, you can add a PIN.
Tidy data, but no garment measurements
Easy to export. Anyone who doesn't reply is left out, and the form doesn't know the chosen garment.
Good for reminders, not for collecting
Replies get lost in the chat and last-minute changes cause confusion.
For small groups
Fine for people already using the same file. Watch out for typos and different versions.
If someone doesn't reply
- Use the real sizes for those who replied.
- For everyone else, use the starting distribution.
- You don't have to wait for everyone, and the estimate only affects the part you don't know.
The mistakes
The most common mistakes
A few checks prevent leftovers.
Check the size chart of the garment you're ordering.
Uniform distribution
The same quantity for every size is the surest way to end up with leftovers.
Ignoring gender
“Mixed” doesn't say enough. Ask for at least a rough idea of how many are men and how many are women.
Not sharing the fit
If the garment is slim or oversized and nobody knows, everyone chooses by a different standard.
Zero extreme sizes
Dropping XS and XXXL leaves out the people who need them. In large groups, one or two pieces beat zero.
No spare pieces
A few extra pieces in L and XL solve many last-minute problems.
Trusting the letter
“I'll take an L” says little if that style fits wider or narrower than usual. The measurements in centimetres are what count.
Frequently asked questions
How many size L to order for 100 t-shirts?
According to SizePlan's estimates, in a generic mixed group of adults L is about 30%, so about 30 pieces out of 100. For mixed students it drops to about 24, and in a women-only team to about 18. These are starting estimates, to adjust for your group.
How do you calculate the size breakdown for 50 garments?
Apply your group's percentages to the total, round them and check that the sum adds up. For a mixed team of 50 people the estimate gives 16 M, 14 L, 9 S and 6 XL, and the remaining 5 pieces go to XS, XXL and XXXL. SizePlan does this sum for you.
What is the most ordered size in Italy for group apparel?
We found no public Italian data. A British supplier, Clothes2order, names L as the most ordered size, at 32% in adult t-shirts. In SizePlan's estimates, L leads among men, companies and generic groups, and M among mixed teams, mixed students and women-only groups.
How do sizes change for sweatshirts compared with t-shirts?
With hoodies, many people go one size up for comfort, so the split shifts towards larger sizes. SizePlan takes this into account when you choose “Sweatshirt / Hoodie”.
Do slim and oversized fits change the size split?
Yes. Slim fit shifts the split towards larger sizes, oversized towards smaller ones. But the measurements in centimetres of the chosen style are what decide it.
Do Italian sizes correspond to European ones?
Not always, and generic conversion charts don't agree with each other. The reliable data is the measurements in centimetres of the chosen style.
Can I use the same distribution for children and adults?
No. Children's sizes are based on age and height. In the SOL'S Regent Fit Kids, for example, 6A is for 106–116 cm and 12A for 142–152 cm. In middle school, adult sizes XS, S, M and L can be used.
Why are the same sizes always left over?
Usually because the same quantity was ordered for every size. XS and XXXL have low demand in most groups, so treating them like the middle sizes creates leftovers.