In a hurry? Calculate the distribution now
Enter the number of pieces and select your target. The tool calculates the optimal distribution in seconds, with animated bar chart and manual adjustment size by size.
Use the free Size FinderSize Finder for Group Orders
The problem no one tells you before ordering
You've decided to make 100 t-shirts for your team, event or company. The supplier asks how many for each size. Complete block.
The most common reaction is ordering equal quantities for all sizes: 14 pieces each. The almost guaranteed result is this — nobody wants the XS and XXXL, the L sizes run out on the first day, two people are left without. You need to make an urgent reorder that costs 20–30% more due to setup printing costs, and you pay for garments you'll never distribute.
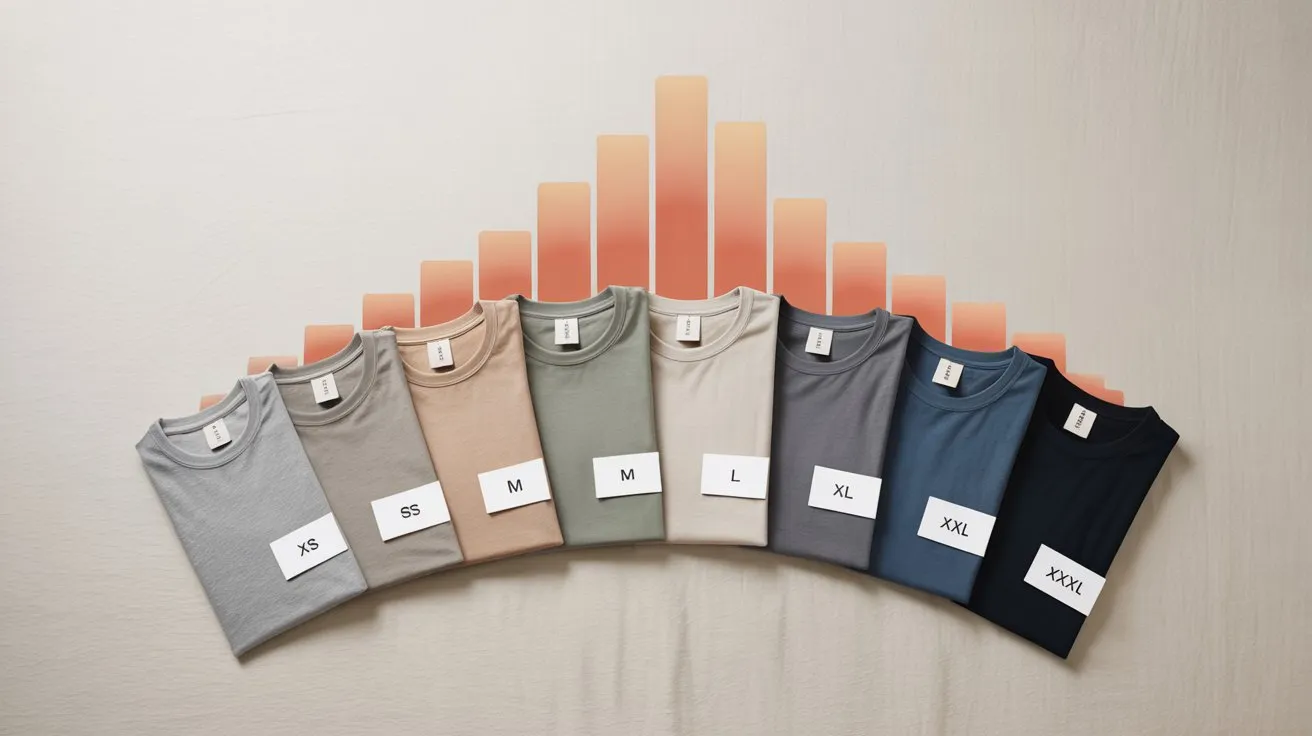
This happens because the real size distribution in the Italian population is not uniform. It follows an asymmetrical bell curve that varies based on age, gender, type of activity and geographical area.
Warning
Promotional apparel suppliers estimate that sizing errors affect on average 10–20% of unplanned orders. The average cost of an urgent reorder increases the unit cost by 15–25%.
What is the size curve and why it changes everything
In the apparel sector, we talk about size curve — the percentage distribution of pieces for each size in an order. It's not an abstract concept: every experienced supplier works with different curves per segment, season and garment type.
The starting point for building a reliable curve is the SizeItaly anthropometric study (an Italian national sizing study), the largest body measurement project conducted in Italy with over 6,000 people analysed and 24,000 scans. Combining this data with ISTAT reports on excess weight and sedentary lifestyle by age group, and with order history data from international apparel printing platforms, clear and replicable statistical patterns emerge.
The variable with the greatest impact on the curve? Gender — which explains about 40% of the total variance. This is followed by the group's average age, the garment type and the specific brand.
Recommended distributions by segment
The following percentages are calibrated for unisex regular fit t-shirts — the most ordered product in group orders. For other garment types, see the dedicated section below.
Sports groups
| Segment | XS | S | M | L | XL | XXL | XXXL | Peak |
|---|---|---|---|---|---|---|---|---|
| Mixed adult team (18–45) | 5% | 18% | 32% | 28% | 12% | 4% | 1% | M |
| Men only (18–45) | 1% | 5% | 18% | 36% | 28% | 9% | 3% | L |
| Women only (18–45) | 8% | 28% | 39% | 18% | 6% | 1% | — | M |
Mixed adult team (18–45)
XS
5%
S
18%
M
32%
L
28%
XL
12%
XXL
4%
XXXL
1%
Peak
M
Men only (18–45)
XS
1%
S
5%
M
18%
L
36%
XL
28%
XXL
9%
XXXL
3%
Peak
L
Women only (18–45)
XS
8%
S
28%
M
39%
L
18%
XL
6%
XXL
1%
XXXL
—
Peak
M
Practical reading: for a mixed team of 50 people, order about 16 size M, 14 size L and 6 size XL. Always consider 1–2 extra pieces in L and XL as buffer for latecomers.
Corporate contexts
| Segment | XS | S | M | L | XL | XXL | XXXL | Peak |
|---|---|---|---|---|---|---|---|---|
| Mixed office employees (25–55) | 2% | 10% | 24% | 30% | 22% | 9% | 3% | L |
| Industry / logistics (mostly men) | 1% | 6% | 18% | 32% | 26% | 12% | 5% | L |
Mixed office employees (25–55)
XS
2%
S
10%
M
24%
L
30%
XL
22%
XXL
9%
XXXL
3%
Peak
L
Industry / logistics (mostly men)
XS
1%
S
6%
M
18%
L
32%
XL
26%
XXL
12%
XXXL
5%
Peak
L
Warning
Geographical gradient (ISTAT data 2023): in Southern Italy, the prevalence of excess weight is about 10 percentage points higher than in the North. For orders destined for Southern Italy, consider shifting 2–3 percentage points from S/M towards XL/XXL.
University students
| Segment | XS | S | M | L | XL | XXL | XXXL | Peak |
|---|---|---|---|---|---|---|---|---|
| Mixed students (19–26) | 5% | 18% | 32% | 24% | 14% | 5% | 2% | M |
| Men only (19–26) | 2% | 10% | 28% | 30% | 18% | 8% | 4% | L |
| Women only (19–26) | 10% | 30% | 35% | 17% | 6% | 2% | — | M |
Mixed students (19–26)
XS
5%
S
18%
M
32%
L
24%
XL
14%
XXL
5%
XXXL
2%
Peak
M
Men only (19–26)
XS
2%
S
10%
M
28%
L
30%
XL
18%
XXL
8%
XXXL
4%
Peak
L
Women only (19–26)
XS
10%
S
30%
M
35%
L
17%
XL
6%
XXL
2%
XXXL
—
Peak
M
Children and seniors
Primary school (6–11 years): for a mixed group without precise age information: 20% size 6A, 28% size 8A, 30% size 10A, 17% size 12A, 5% size 14A. The peak is 10A.
Lower secondary school (11–14 years): if using adult sizes XS–L, the recommended distribution is 25% XS, 40% S, 25% M, 10% L. Almost no child in this age range requires XL or above.
Senior group (55+): the curve shifts significantly to the right. Distribution: 1% XS, 6% S, 18% M, 28% L, 25% XL, 15% XXL, 7% XXXL. Don't order XS for this segment — it's almost certainly an undistributed garment.
Four factors that modify the base distribution
The tables above are a starting point, not a definitive answer. Four variables modify it significantly.
3 factors + 1 that modify the base distribution
The tables above are a starting point, not a definitive answer. Four variables modify it significantly.
Hooded sweatshirts show the most pronounced "sizing up" behaviour: approximately 35% of users prefer to order one size larger for comfort and style. The base distribution should therefore be adjusted towards larger sizes compared to t-shirts in the same segment. For jackets and gilets, which are often worn over other garments, add 2–3 percentage points to XXL and XXXL compared to the base distribution. For polo shirts, the fit is usually accurate — people tend to order their true size without adjustments. The base distribution applies without modifications.
The specific brand
The sizing system is not standardised. Each brand has different actual measurements for the same letter.
| Brand | Cut | Effect | Practical advice |
|---|---|---|---|
| Gildan | American boxy, generous | Those used to European brands tend to size down | Communicate the fit before ordering |
| Stanley / Stella | European medium fit, fitted | Those used to Gildan will need to size up | Recommend checking the size chart in cm |
| SOL'S | French slim fit, runs small | SOL'S M corresponds to S in many other brands | Consider +1 shift across entire distribution |
| B&C / Kariban | Standard European regular fit | Base distribution applicable without modifications | Neutral reference for most orders |
| Fruit of the Loom | Slightly tapered, standard | Base distribution applicable | Excellent starting point |
Gildan
Cut
American boxy, generous
Effect
Those used to European brands tend to size down
Practical advice
Communicate the fit before ordering
Stanley / Stella
Cut
European medium fit, fitted
Effect
Those used to Gildan will need to size up
Practical advice
Recommend checking the size chart in cm
SOL'S
Cut
French slim fit, runs small
Effect
SOL'S M corresponds to S in many other brands
Practical advice
Consider +1 shift across entire distribution
B&C / Kariban
Cut
Standard European regular fit
Effect
Base distribution applicable without modifications
Practical advice
Neutral reference for most orders
Fruit of the Loom
Cut
Slightly tapered, standard
Effect
Base distribution applicable
Practical advice
Excellent starting point
Pro tip
The advice that makes the difference: when choosing a brand your participants don't know, always send the size chart in centimetres (chest width and total length) rather than relying only on XS–XXXL letters. It's the only objective data that eliminates ambiguity.
How to collect sizes reliably
Before relying on statistical distribution, assess whether you can collect individual sizes. For orders under 15–20 pieces it's almost always the best choice.
For larger orders, these are the methods most used by organisers and their real limitations:
How to collect sizes reliably
For larger orders, these are the methods most used by organisers and their real limitations:
The most widespread method (about 60% of organisers). Structured data, easy to export. Limitation: typically 15–25% of participants never respond, 10–15% respond late after order closure.
Warning
The convincing number: in a typical group order, 10–20% of garments end up with incorrect sizes post-delivery. Since custom garments are generally non-returnable, this generates a direct cost increase of 10–20% (reorders, logistics, urgent shipping) and measurable dissatisfaction in the group.
Converting between sizing systems
If ordering from international suppliers, the correspondence between systems isn't immediate. The Italian (IT) system is on average tighter than the American (US) and slightly different from the European (EU).
| Size | IT Men | EU | US | UK |
|---|---|---|---|---|
| XS | 44 | XS (44) | XS | 32–34 |
| S | 46–48 | S (46) | S | 36–38 |
| M | 48–50 | M (48) | M | 38–40 |
| L | 52–54 | L (52) | L | 42–44 |
| XL | 56–58 | XL (54) | XL | 46–48 |
| XXL | 60 | XXL (56) | XXL | 50 |
| XXXL | 62 | 3XL | XXXL | 52 |
XS
IT Men
44
EU
XS (44)
US
XS
UK
32–34
S
IT Men
46–48
EU
S (46)
US
S
UK
36–38
M
IT Men
48–50
EU
M (48)
US
M
UK
38–40
L
IT Men
52–54
EU
L (52)
US
L
UK
42–44
XL
IT Men
56–58
EU
XL (54)
US
XL
UK
46–48
XXL
IT Men
60
EU
XXL (56)
US
XXL
UK
50
XXXL
IT Men
62
EU
3XL
US
XXXL
UK
52
Children's sizes — age/height correspondence:
| IT Size | Indicative age | Height (cm) |
|---|---|---|
| 6A | 6–7 years | 116–122 |
| 8A | 8–9 years | 122–134 |
| 10A | 10–11 years | 134–146 |
| 12A | 12–13 years | 146–158 |
| 14A | 14–15 years | 158–170 |
6A
Indicative age
6–7 years
Height (cm)
116–122
8A
Indicative age
8–9 years
Height (cm)
122–134
10A
Indicative age
10–11 years
Height (cm)
134–146
12A
Indicative age
12–13 years
Height (cm)
146–158
14A
Indicative age
14–15 years
Height (cm)
158–170
The most common mistakes in group orders
These are the recurring patterns that emerge from data of those working daily with custom apparel orders.